As the global initiative to reach carbon neutrality continues, hydrogen and ammonia are gaining interest as fuels due to their lack of carbon dioxide emissions. Along the ammonia supply chain, there is ammonia synthesis, which uses nitrogen and hydrogen as feedstock, ammonia transportation, storage, distribution, and either direct utilization of the ammonia as fuel or decomposition to hydrogen for use. As a result, flares at facilities throughout the supply chain must be designed to handle a range of mixtures composed of ammonia, nitrogen, and hydrogen. Ammonia presents challenges as a fuel due to its slow flame speed, narrow flammability limits, and high ignition temperature, all of which are exacerbated when diluted with nitrogen. Enriching mixtures of ammonia and nitrogen with hydrogen can be an effective design in overcoming these challenges. Natural gas or fuel gas can and has been used as an enrichment stream; however, due to these fuels’ associated carbon dioxide emissions, hydrogen is an appealing alternative. Additionally, hydrogen’s wide flammability limits and fast flame speed means a lower percentage of hydrogen can be used to achieve the desired combustion performance when compared to other gases. This paper discusses the full-scale combustion performance testing of ammonia and enrichment of ammonia/nitrogen mixtures with hydrogen. The intent of this research is to continue progressing safe and efficient designs for flaring process streams containing ammonia.
INTRODUCTION
Historically, flares have handled and disposed of a wide range of hydrocarbons from natural gas to olefins and aromatics. Many studies have been performed and published regarding flare efficiency when handling hydrocarbons, most notably the “Flare Efficiency Study” by Marc McDaniel in the 1980s. Elements of that flare study were sponsored by the United States Environmental Protection Agency (U.S. EPA) and Chemical Manufacturers Association (CMA) and would later be the foundation for establishing minimum allowable lower heating values and maximum allowable exit velocities for un-assisted, steam-assisted, and air-assisted flares. These requirements are detailed within 40 CFR 60.18 and 40 CFR 63.670. Many of these past flare efficiency studies have been performed using hydrocarbons with relatively similar flame speeds, autoignition temperatures, and flammability limits (e.g., propylene, natural gas, propane). As the world progresses towards carbon-free fuels such as ammonia and hydrogen, flare manufacturers and their clients must understand the appropriate design parameters for an ammonia flare. In November 2024, Zeeco and Air Products executed a flare efficiency study using ammonia and various mixtures of ammonia, hydrogen, and nitrogen. The goals of the study were to determine the Destruction Removal Efficiency (DRE) of ammonia, establish minimum hydrogen enrichment versus nitrogen dilution, and record nitrogen oxide (NOx) emissions.
DESIGN CONSIDERATIONS
The most prominent challenges in flaring ammonia are maintaining a stable flame while achieving high destruction efficiency. These challenges are unique compared to a typical (hydrocarbon) flare due to ammonia’s slow burning velocity, low flame temperature, high autoignition temperature, and volumetrically limited flammability range. Flare vendors must implement sufficient flame stabilization methods to prevent flame instability, which can result in lower destruction efficiency (i.e., unacceptable emissions of unburnt ammonia) or a flame-out scenario, which can be potentially damaging to the environment and dangerous to personnel. Table 1 lists the properties of ammonia, hydrogen, and other hydrocarbon fuels.
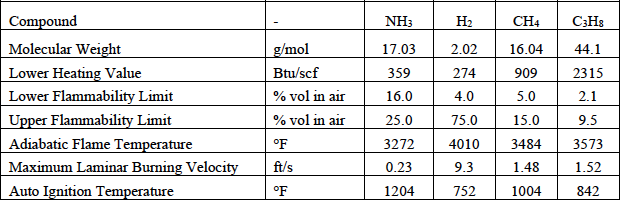
Table 1. Summary of fuel properties.
Various hydrocarbons can be used to enrich a flare gas stream. The most common is natural gas; however, hydrogen can be used without increasing carbon dioxide emissions. Additionally, hydrogen has a high burning velocity, high flame temperature, and wide flammability range, which improves its effectiveness as an enrichment fuel. Flare gas containing hydrogen has been studied in depth with respect to combustion properties and performance. One example of such work is within the “Hydrogen Flare Equivalency Demonstration” in the 1990s by the Energy and Environmental Research Corporation. This testing was performed on hydrogen and nitrogen mixtures with small percentages of ethylene added to measure destruction efficiency. It is critical to understand the implications of substituting ammonia in these mixtures, as the poor combustion characteristics of ammonia will impact the flare performance.
When considering combustion of a compound with fuel-bound nitrogen, NOx generation proceeds via two pathways – thermal NOx and fuel NOx. One would expect enrichment using hydrogen could further increase the thermal NOx as hydrogen increases flame temperature. Historically, NOx from flaring has carried less importance compared to destruction efficiency. Flares do not utilize any NOx control methods, and the industry uses averages of NOx emissions produced by various flare tip designs and compositions; however, in recent years, greater emphasis has been placed on all performance criteria for flares, including NOx emissions. The EPA publishes commonly accepted air emissions factors for various sources within AP-42.
Flares specifically are described in Chapter 13.5 “Industrial Flares”. Elevated flares are listed as
0.068 lb/MMBtu based on tests using 80% propylene and 20% propane [4]. The Texas Commission on Environmental Quality (TCEQ) has published information regarding flare NOx emissions separated into high BTU and low BTU categories for steam-assisted, air-assisted, or unassisted flare tips. Additionally, TCEQ notes, the fuel NOx generated is assumed to be 0.5 weight percent of the inlet ammonia mass flowrate. TCEQ states the ammonia to fuel NOx conversion is subject to case-by-case review [3]. For example, if the flare inlet flow is 10,000 lb/h of ammonia, then the fuel NOx emission rate would be 0.5% of 10,000 lb/h, which is 50 lb/h. The study and testing conducted by Zeeco in November 2024 gathered data to support NOx emissions from ammonia-containing flare gas streams.
TESTING
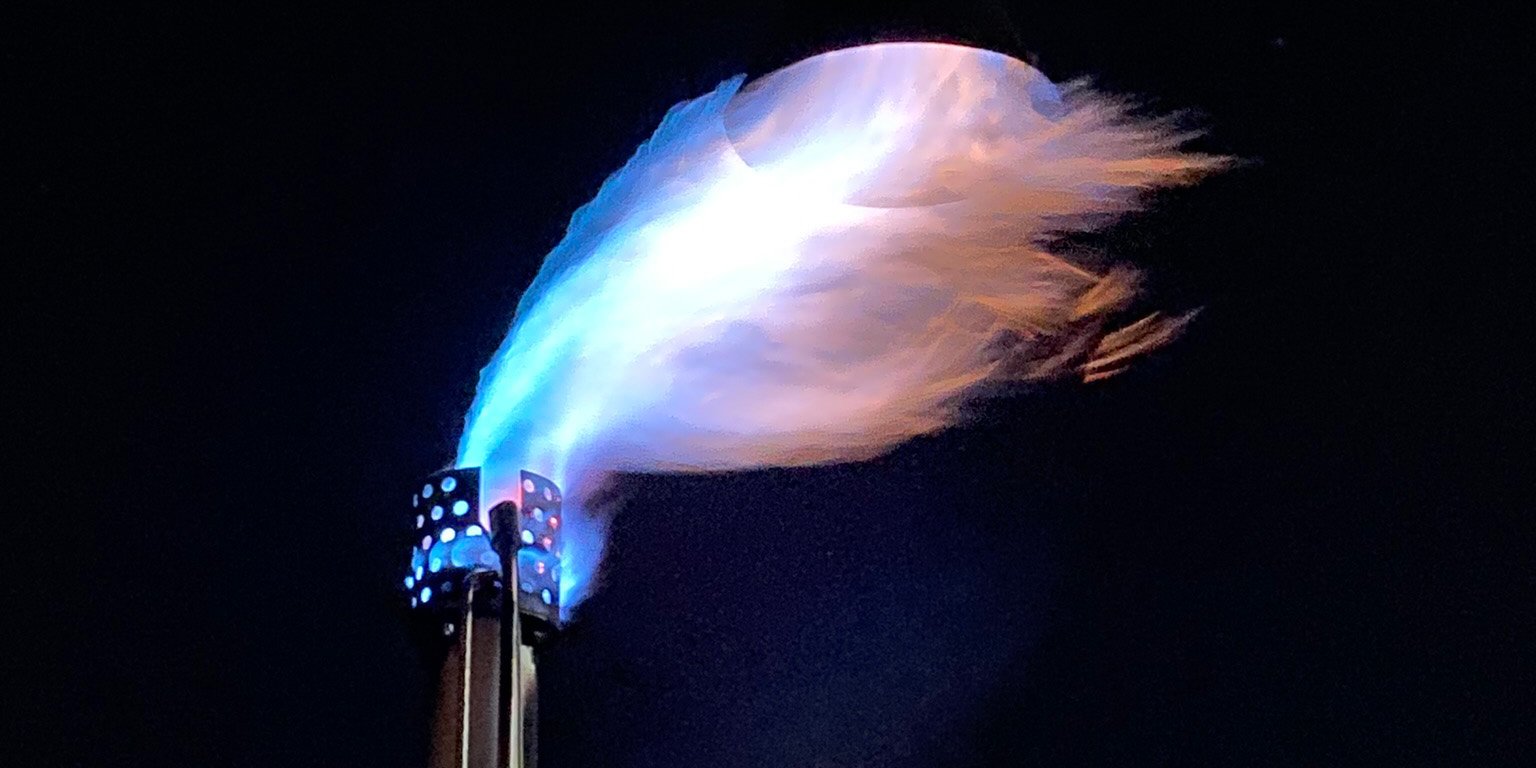
The flare testing was performed at Zeeco’s Global Technology Center (GTC) in Broken Arrow, Oklahoma. A 10-inch pipe flare (ZEECO Model UFW-10) was utilized and outfitted with two (2) ZEECO Model HSLF pilots. During the testing, the pilots operated on hydrogen fuel. Ammonia and nitrogen were supplied as liquid and vaporized before being sent to the flare. Hydrogen was supplied as a vapor in a tube trailer. Orifice flow meters were used for controlling and measuring each individual flare gas component. A specially constructed sample hood, which used compressed air to draw in the exhaust, was hoisted by a crane over the flare flame to capture the combustion plume. The plume sample was transported by heated sample line to a mobile laboratory for analysis. The emission data included oxygen [O2], ammonia [NH3], and nitrogen oxides [NOx].
The testing began with 100% ammonia, ranging from low to high exit velocity. Unlike hydrocarbon flares, ammonia flaring requires understanding and consideration of the performance at low exit velocity and high exit velocity. A hydrocarbon flare is typically limited by a maximum allowable exit velocity only. However, due to ammonia’s poor combustion properties, two different mechanisms must be considered. At high exit velocity, the flame can destabilize because the flare gas velocity exceeds the turbulent flame speed. As the exit velocity increases, the air entrainment of the flare increases, leading to a more diluted combustion zone. So, at high exit velocity, the limiting mechanism is the reaction speed of the components inside the combustion zone. At low exit velocity, mixing becomes the limiting mechanism because the flare gas has less momentum. The flare gas must be mixed and form a combustible mixture with ambient air quickly enough while near the ignition source (i.e., pilots). Figure 1 and Figure 2 illustrate successful ammonia combustion at low flow and high flow.
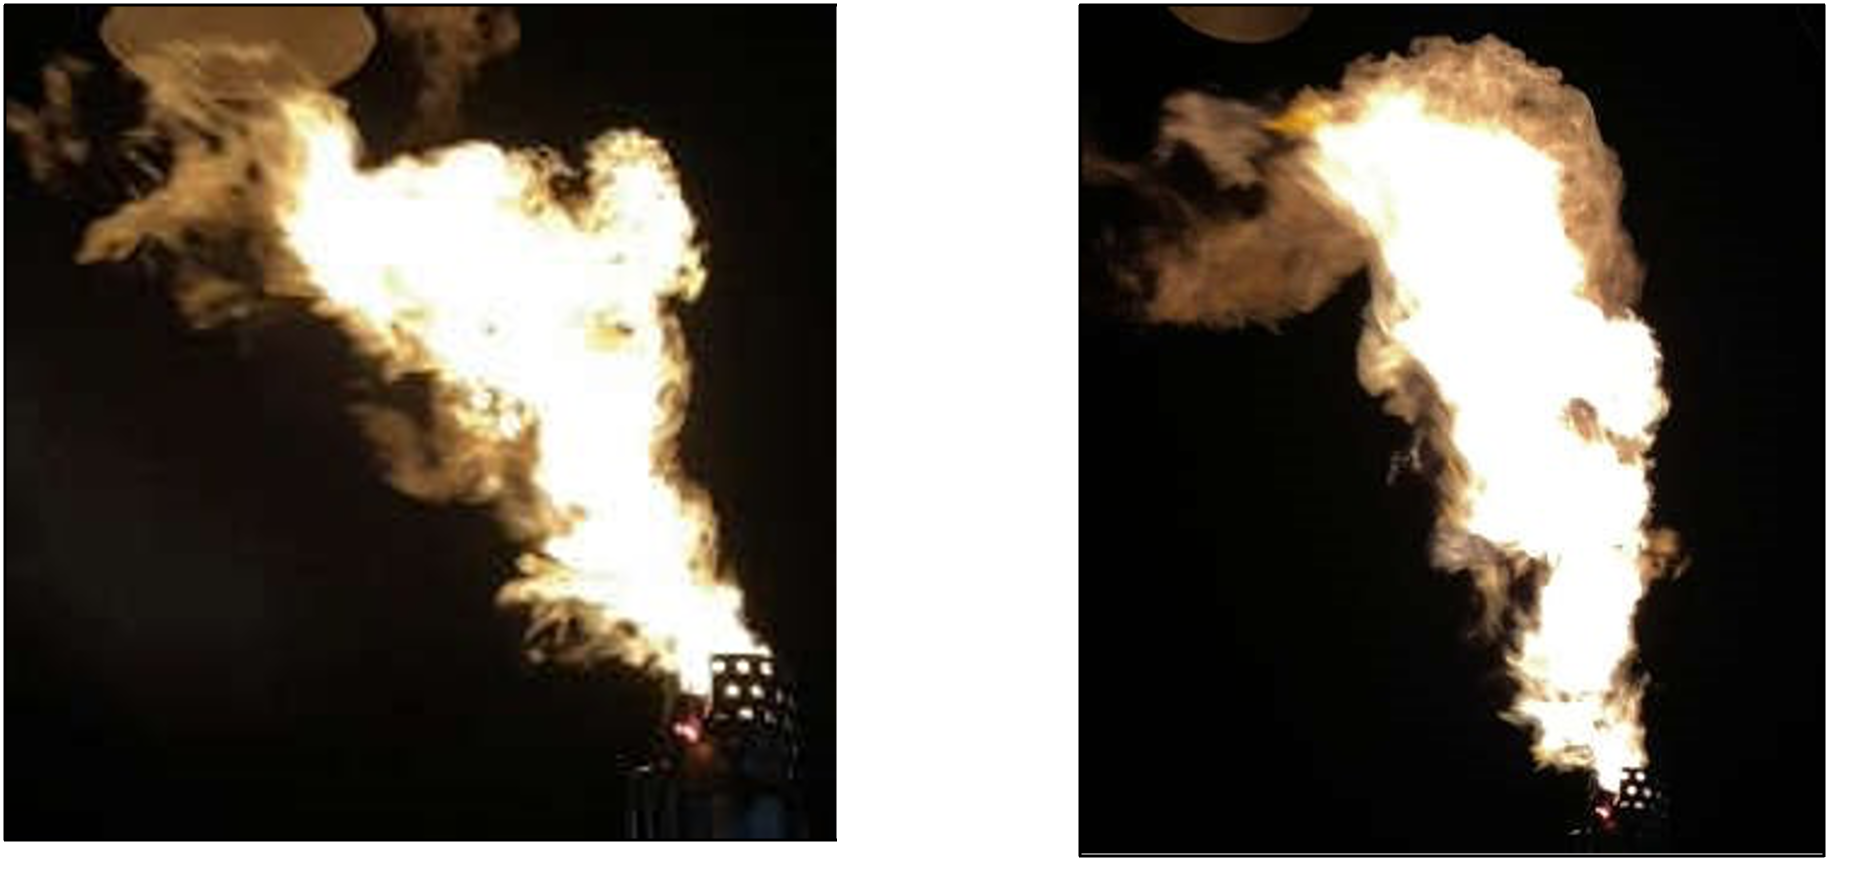
Figure 1. Low flow flaring 100% ammonia. Figure 2. High flow flaring 100% ammonia.
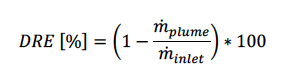
The testing continued by varying the amount of nitrogen and hydrogen within the flare gas to evaluate the minimum hydrogen enrichment required to maintain a stable flame and to observe the impact on the destruction efficiency. Equation 1 was used for determining the DRE of ammonia.
Hydrogen is a valuable compound; therefore, it is important to accurately predict the minimum required hydrogen enrichment to reduce the flare’s operating cost while maintaining acceptable destruction of ammonia. Figure 3 illustrates the destruction efficiency of ammonia versus a characteristic temperature for all the test points performed. These test points range from 100mol% ammonia to 0.7mol% ammonia mixed with nitrogen and hydrogen. A characteristic temperature was determined, which correlated with destruction efficiency. To achieve acceptable destruction of the given component, the characteristic temperature must meet or exceed the minimum value as illustrated by the red vertical line in Figure 3. One test point was classified as an outlier, as designated by the blue ‘X’. During the test point, a large hydrogen orifice meter was used to inject a small flowrate of hydrogen, which was below the controllable range for that size orifice meter. A similar flare gas mixture was used on a subsequent test point with the correctly sized orifice meter and achieved a higher destruction efficiency.
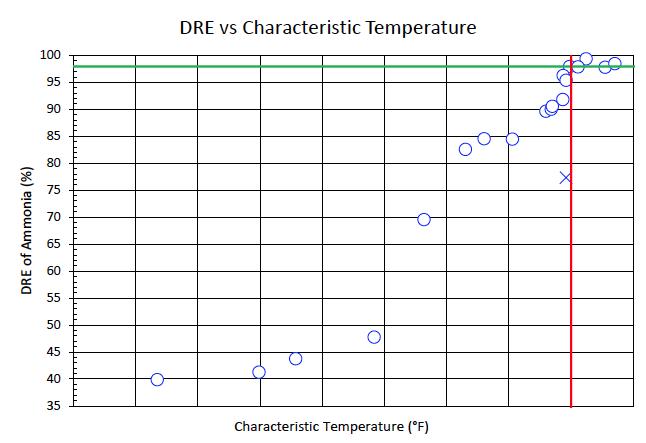
Figure 3. Destruction removal efficiency of ammonia versus characteristic temperature.
As mentioned in the Design Considerations section, there are common NOx emission factors published by the EPA and others based on historical flare tests. These past flare studies have included mostly hydrocarbons, while ammonia flaring has not been studied to the same extent. For example, U.S. EPA AP-42 lists nitrogen oxides from elevated flares at 0.068 lb/MMBtu based on a mixture of crude propylene containing 80% propylene and 20% propane [4]. TCEQ has processed the data further, providing the NOx emission factors according to steam-assisted versus air/un-assisted for low or high Btu gas streams [2]. Table 2 lists these emission factors. TCEQ defines high Btu as greater than 1,000 Btu/scf and low Btu as between 192 and 1,000 Btu/scf.
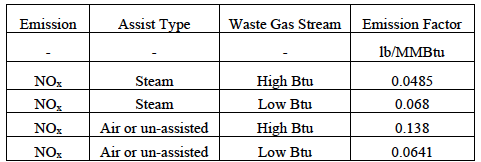
Table 2. Summary of NOx emission factors provided in TCEQ RG-360/21.
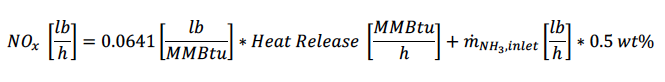
As discussed, NH3 flaring should consider thermal NOx and fuel NOx because NH3 is a nitrogencontaining compound. TCEQ states fuel NOx from NH3 to be 0.5 weight percent of the inlet NH3 – subject to case-by-case review [3]. Equation 2 lists the formula for determining NOx emissions based on the TCEQ NSR Emission Calculations document.
The NOx emissions were calculated for each test point using equation 2 and were graphed against the actual NOx emissions measured during testing in Figure 4. The test data was divided into three different datasets as indicated by the colors. Blue data points indicate 100% ammonia, the pink data points are between 50-56mol% ammonia, and the yellow data points are between 0.6-26mol% ammonia. Test points which have been included demonstrated DRE greater than 90%. As the DRE decreases, the results become inaccurate as a significant portion of the flared gas remains unreacted. As shown, it can be concluded that the TCEQ prediction for NOx is reasonably accurate.
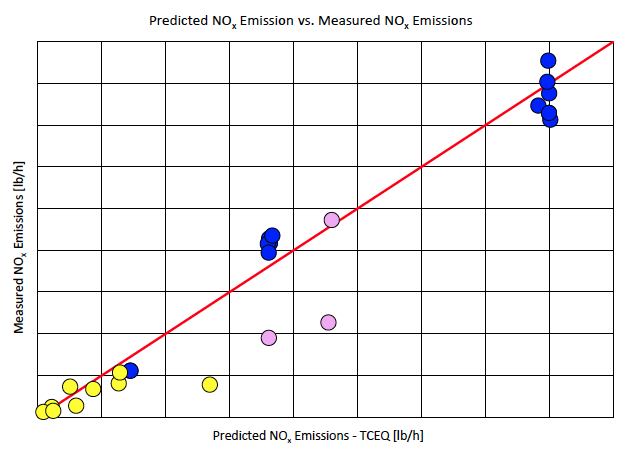
Figure 4. Calculated NOx emission rate [lb/h] per TCEQ guidelines versus measured NOx emission rate [lb/h] during testing.
COMPUTATIONAL FLUID DYNAMICS (CFD) MODELING
Several test points were selected for comparison with CFD modeling. Full-scale testing of equipment is typically the most robust method of confirming performance. However, testing has certain challenges as well – such as safety considerations, potentially high cost, and scheduling. So, having an alternative method of validating flare performance and design is imperative. While gathering full-scale test data was the primary purpose, validating CFD model parameters and methodology against test data was an important secondary purpose because it is critical for continued understanding and improvement of ammonia flaring. Test data was compared with CFD modeling with respect to flame length, destruction efficiency of 100% ammonia flare gas across a range of exit velocities, and destruction efficiency of flare gas streams enriched with hydrogen.
Three test points were selected for 100% ammonia across a range of exit velocities. Two hydrogen enrichment test points were selected, ranging from 39mol% to 54mol% dilution with nitrogen. All models were Reynolds-Averaged Navier-Stokes (RANS) using Eddy Dissipation Concept (EDC) turbulence-chemistry interaction model [5] and the recent H-N-O chemical kinetic mechanism of Doner et al. [6]. The CFD mesh contained approximately 8.4 million cells.
The flame shape was the first piece of the model to be evaluated. Estimating the flame length of a flare is a key input for various design considerations, including radiation and dispersion of unburnt flare gas. Since there are no carbon-containing compounds, traditional methods of estimating the flame shape via carbon monoxide iso-surfaces are not applicable. The steady-state model was compared with the video footage from testing to determine the appropriate quantity iso-surface to represent the visible flame boundary. The comparison between the test results and CFD results are shown in Table 3. Additionally, Figure 5 illustrates the iso-surfaces selected to represent the visible flame boundary in the CFD model for 100% ammonia flaring.
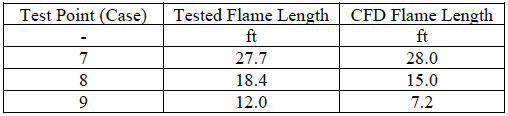
Table 3. Average flame length as measured during testing and CFD modeling.
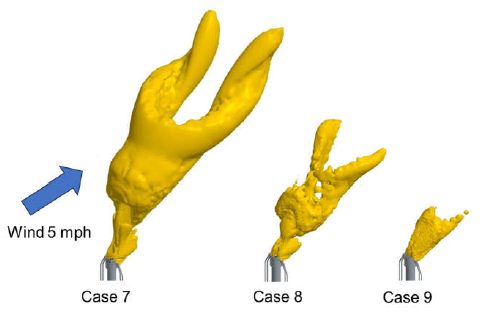
Figure 5. Iso-surfaces for determining flame shape of 100% ammonia flaring.
Another purpose of the testing was to determine the destruction efficiency of 100% ammonia at various exit velocities. Figure 6 illustrates the difference in measured destruction efficiency versus the CFD model destruction efficiency with respect to exit velocity.
During testing of 100% ammonia, one test point was speculated to be an outlier based on the decrease in destruction efficiency despite having the lowest exit velocity. The CFD helped to confirm this theory by demonstrating the largest difference in predicted destruction efficiency for the low exit velocity test point. As the exit velocity increased, the measured efficiency and CFD showed reasonable agreement.
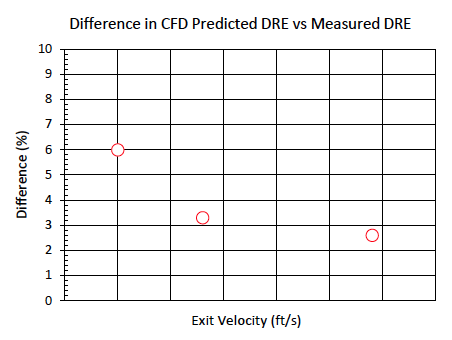
Figure 6. Difference between measured DRE and CFD for 100% ammonia tests versus flare exit velocity.
The last objective of the testing was to use the hydrogen enrichment test results to validate the CFD model regarding ammonia destruction efficiency across a range of compositions. Three test points that achieved high destruction efficiency were selected for this analysis. Figure 7 illustrates the difference in measured destruction efficiency versus the CFD model destruction efficiency with respect to hydrogen enrichment. Hydrogen enrichment greatly improved the destruction efficiency of ammonia in the flare gas despite significant dilution by nitrogen. CFD successfully captured the effects of the hydrogen and showed reasonable agreement across the range of test conditions.
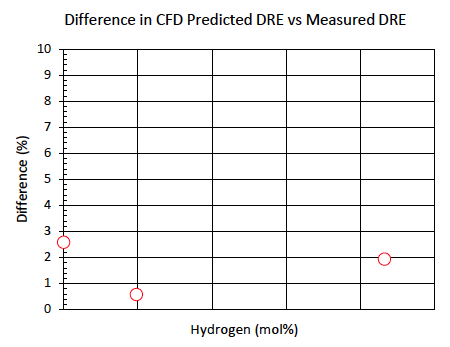
Figure 7. Difference between measured DRE and CFD for hydrogen, nitrogen, and ammonia mixtures.
PROJECT INSTALLATION
Zeeco had the opportunity to supply flare systems to Air Products for the NEOM Green Hydrogen Complex located in the Kingdom of Saudi Arabia. This novel project leverages proven technologies to produce green hydrogen. The project will utilize renewable energies (i.e., solar and wind) to produce green hydrogen via electrolysis of water and nitrogen via air separation units. The hydrogen and nitrogen will be converted to ammonia for distribution and downstream use [7]. The flare testing and subsequent CFD modeling was a critical step in verifying the flare performance and supporting a methodology for determining minimum hydrogen enrichment.
CONCLUSION
Testing has been performed at Zeeco’s Global Technology Center with the purpose of collecting emission data to support ammonia flaring applications. Hydrogen enrichment of the flare gas was used to offset dilution with nitrogen to maintain a stable flame and achieve acceptable destruction of ammonia. The test was successful in validating the minimum hydrogen required in these designs, with further agreement by CFD modeling. The test results and CFD modeling showed agreement in the general trends and reasonable agreement for the destruction efficiency.
Ammonia applications continue to increase, which demands more research into effectively flaring the associated process streams. While ammonia flaring has been done for several decades, fullscale testing and validated CFD modeling are useful tools to improve flare design, operation, and minimize environmental impact. Zeeco’s testing has provided fundamental data in this direction. Zeeco has developed a method for testing open ammonia flares and has used the resulting test data to verify an accurate CFD model for ammonia applications, confirm a safe and reliable flare tip design, and support an appropriate operating methodology for ammonia flaring. Additionally, the testing has successfully proven hydrogen enrichment as an effective method for improving the destruction efficiency of ammonia diluted with nitrogen.